What are the top 10 best Tractors
A ranking with a published method, which you are welcome to disagree with.
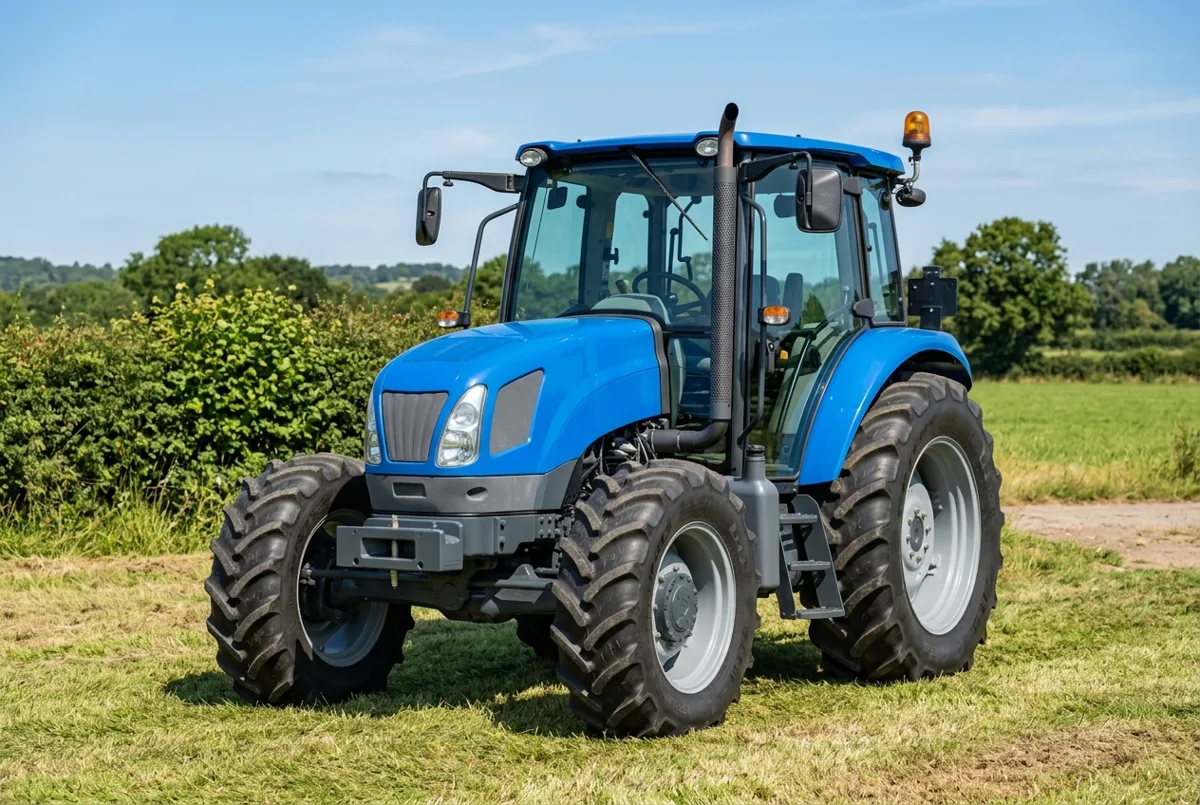
The New Holland T4.75, one of the machines discussed below.
Every “top 10 tractors” article is one person’s opinion with a number stuck on the front. There is no measurement of “best”, because best depends on your ground, your implements and your budget, and nobody writing a list knows any of those.
So this ranks something that can actually be counted: how much independent laboratory evidence exists for a machine. It is not the same question, and we would rather answer a different question honestly than this one dishonestly.
From our database
The method, so you can disagree with it. Machines are ranked by the number of distinct OECD test reports citing them, then by how many measured power figures those reports recorded, then by name. The claimed-versus-measured gap is shown but never ranked on — a small gap is a property of the driveline, not a virtue. Queried 2 October 2026.
The ten below are covered by 28 separate test reports between them, and 9 of the ten also carry a manufacturer’s claim, so the gap can be stated.
- New Holland T4.75 (2011) — 5 test reports, 24 measured figures. Gap 25.2%.
- Case-IH MX 100 (1997) — 4 reports, 24 measured figures. Gap 14.4%.
- Case-IH MX 110 (1997) — 3 reports, 20 measured figures. No claimed engine figure on record, so no gap can be stated — which is the one honest answer when a number is missing.
- John Deere 7710 (1997) — 3 reports, 12 measured figures. Gap 9.9%.
- John Deere 7810 (1997) — 3 reports, 12 measured figures. Gap 9.8%.
- Case-IH Puma 165 (2007) — 2 reports, 15 measured figures. Gap 15.1%.
- Case-IH JX 1075 C (2003) — 2 reports, 12 measured figures. Gap 14.8%.
- Renault Ares 696 RZ (2001) — 2 reports, 12 measured figures. Gap 9.2%.
- Renault Ceres 325 (2000) — 2 reports, 12 measured figures. Gap 14.2%.
- Renault Ceres 335 (2000) — 2 reports, 12 measured figures. Gap 9%.
What the gap column shows, read across the ten. The widest is the machine at the top of the list: 25.2% between what the maker claimed at the engine and what a laboratory measured at the shaft. The narrowest is 9%. That is a spread of more than two to one across machines that are all thoroughly tested, which is the point worth taking from the column — the gap is a property of each driveline, not a constant you can apply to a brochure figure to work out the truth.
One of the ten carries no gap at all, and it is worth dwelling on why. We hold three test reports for it and twenty measured figures, and no manufacturer’s claimed engine figure that we can source. The machine is better documented than almost anything else in our records and we still cannot tell you what its maker said about it. A missing number stays missing rather than being filled in from a sister model.
Why rank by evidence rather than by quality?
Because quality has no unit and evidence does.
Ask what a ranking by quality would even measure. Reliability? Nobody publishes comparable failure rates. Resale? That is a market, not a machine. Comfort? That is a person. Every list claiming to rank tractors is ranking one of those things badly, or ranking nothing at all and calling it experience.
Evidence can be counted. A machine with five independent test reports has been put on a dynamometer five times by people with no stake in the answer, and what we can say about it is correspondingly better founded than what we can say about a machine with none.
That is not the same as it being better. It is a statement about how much is known.
It also cuts the other way, and the ranking does not hide it. A tractor appears here because somebody paid to test it, and manufacturers test machines they intend to sell into markets that require a test certificate. Plenty of excellent tractors were never submitted because they were never sold where a test was demanded. Absence from this list is not evidence of anything.
What makes a test independent?
That the people running it are not the people selling the tractor.
An OECD test is conducted to a published standard code at an approved station, and the report is filed with the result the machine produced rather than the result anyone hoped for. That is the whole value of it. A manufacturer’s own figure may be perfectly accurate and is still a number with an interest attached, which is why this site labels every figure with its basis and why the ranking above counts only the independent ones.
It is also why the count matters more than any single report. One test is one machine on one day at one station. Five tests of the same model, as the machine at the top of this list has, describe a design rather than a sample.
What does a test report actually contain?
A measured power figure at the power take-off, usually at several conditions, and often a drawbar figure as well.
The condition matters more than readers expect. The same machine produces different legitimate figures at maximum power, at its rated engine speed, and at the standard 540 or 1000 shaft speed, and quoting the largest without saying which run it came from makes a tractor look better than the test found it. That is covered in full in why PTO horsepower is lower than engine horsepower.
Why are the dates clustered?
Because our evidence is, and saying so is part of the method.
The machines above are mostly from the 1990s and 2000s. That is where the test reports we hold cluster, not where the good tractors are. Most tractors ever built were never tested at all, and a ranking by evidence will always describe the testing rather than the industry.
A reader who wants the whole tested set rather than the top of it can see every machine we hold a laboratory figure for in the PTO horsepower list.
What would change this ranking?
More tests, or better records of the ones that exist.
The ranking is recomputed from the database on every build, so it moves when the data moves. If a machine below gains a report it rises; if we find a claimed figure for the one that currently has none, a gap appears beside it.
Machines, makes and the full specification for every tractor here are in the tractor index, and our data methodology sets out what has to be true before any of it publishes.
Common questions
- Is this a list of the best tractors?
- No, and no honest list of that kind exists. It ranks the machines we hold the most independent laboratory evidence for, which is a different question and the only version of it we can answer from data rather than from opinion.
- Why are so many of them from the 1990s and 2000s?
- Because that is when the test reports we hold were written. Most tractors ever built were never put on a dynamometer, and the testing we have access to clusters in those two decades. It is a fact about our evidence, not about the machines.
- Does a smaller claimed-versus-measured gap mean a better tractor?
- No, and that is why the ranking is not built on it. The gap is mechanical loss between the engine and the shaft, and a tracked machine loses more than a wheeled one for reasons that have nothing to do with quality. It is reported here because it is interesting, not because it is a score.
Sources
- OECD standard codes for the official testing of agricultural tractors, reports cited per machine — OECD. Figures from these test reports are cited per machine on each model page, from the report records in our database; we hold no fetched copy of the OECD programme's web pages.
- Traktorenlexikon, the model articles cited on each tractor's page — Wikibooks, CC BY-SA 4.0. Retrieved . Original