Why is PTO horsepower lower than engine horsepower?
Every figure below comes from a laboratory test report, and every one is cited.
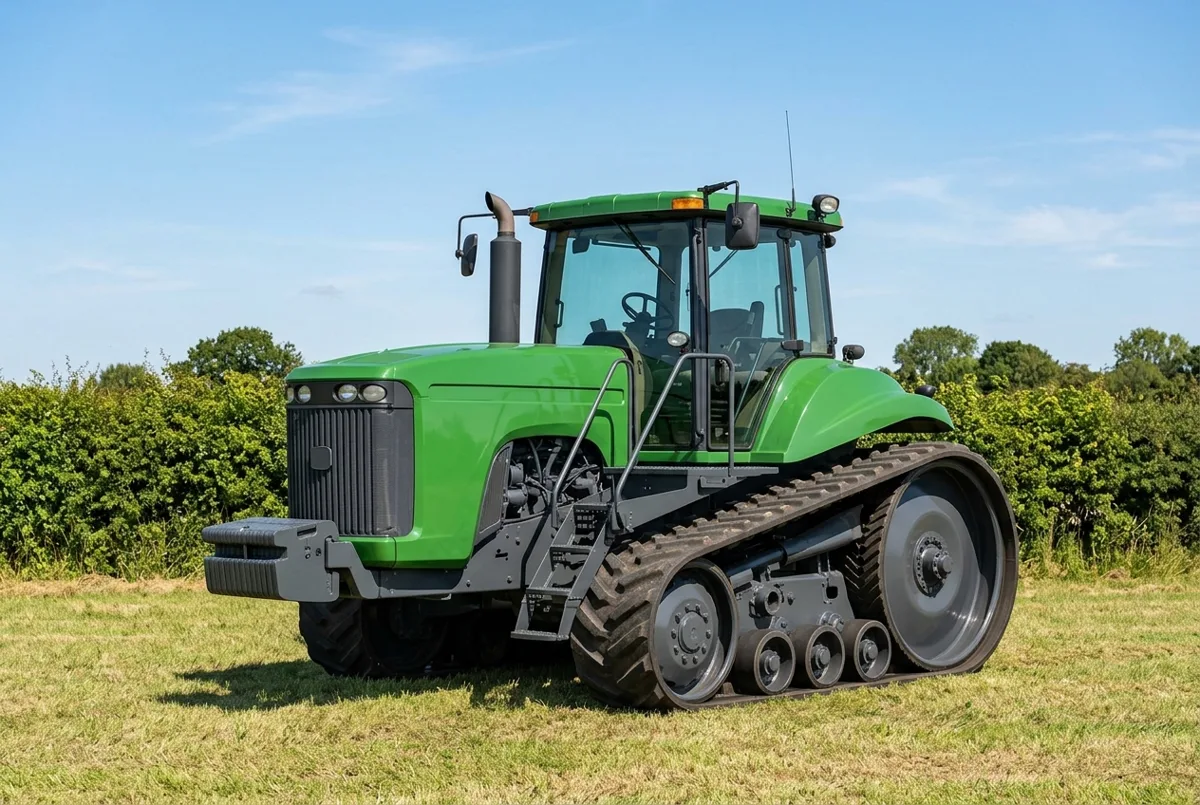
The John Deere 9620T, one of the machines discussed below.
A tractor brochure quotes a power figure taken at the engine. The work is done somewhere else — at the power take-off, after the clutch, the PTO drive and its gearing have each taken a share. The two numbers are not the same, they were never meant to be, and the distance between them is the single most useful thing a specification sheet does not tell you.
We hold 3,232 tractors with sourced specifications, from 1913 to 2023, across 85 makes. 185 of them carry both a manufacturer’s claimed engine figure and a laboratory measurement taken at the shaft. That overlap is small, and it is the only place this question can be answered with evidence rather than opinion.
How much power actually reaches the power take-off?
Compared at the engine’s rated speed — the condition a maker’s claimed figure is quoted at — the shaft delivers 11.4% less on average. The shaft came in below the claim on 180 of the 185 machines, and above it on 5.
The condition matters more than the average does. The same tractors, compared at the standard 540 or 1000 rev PTO speed, show a gap of 8.8%. Compared at the engine’s maximum-power point — a different engine speed, and the engine’s best moment — the gap falls to 4.8%. One set of machines, one set of test reports, three answers. Quoting the smallest of them without saying which run it came from would make a tractor look better than the test found it.
Which tractors lose the most between engine and shaft?
The John Deere 9620 T, built 2002–2007, is the widest in our records: 368 kW claimed at the engine, 241.7 kW measured at the shaft.
It is not alone at the top, and the company it keeps is most of the explanation. Three of the four widest gaps we hold belong to tracked machines — the 9620 T, the 9400 T and the 9520 T. A rubber-track undercarriage puts more driveline between the crankshaft and the output than a wheeled tractor does, and it takes its share. Reading that list without noticing they are crawlers would lead a reader to conclude that one manufacturer overstates by a third, which is not what the tests show.
The fourth is not a crawler, and it is worth saying so rather than tidying it away: a wheeled compact sits third on the list.
At the other end of the scale the losses are proportionally similar on much smaller machines. The New Holland T4.75 claims 63 kW and measured 44.6–47.1 kW at the shaft across its tested versions. The Case-IH JX70, built 2004–2008, claims 50–50.7 kW and measured 42.1 kW.
Is the manufacturer’s figure dishonest?
No, and the data is what settles it rather than good manners.
If makers were inflating their numbers, a claimed figure and a measured figure of the same quantity would disagree. We hold very few tractors carrying both a claimed PTO figure and a measured one, and on those the measured figure is very slightly higher than the claim. The engine-to-shaft gap is mechanical loss in the driveline. It is physics, it is unavoidable, and a maker quoting engine power is describing the engine accurately.
What the brochure does not do is answer the question the buyer is asking, which is how much of that power will turn an implement.
What should a buyer do with this?
Three things follow from the numbers above.
Compare measured with measured. A measured figure and a claimed one are not comparable, and a table that puts them in the same column is telling you about its own sourcing rather than about the tractors. Where both machines have been tested, compare the tests. Where only one has, the honest answer is that they cannot be ranked on power.
Read the test condition, not only the number. The same machine produces three defensible PTO figures depending on the run. A figure without its condition is not a specification.
Assume the shaft, not the flywheel. If the only figure available is the maker’s engine rating, a working assumption of roughly a tenth less at the power take-off is closer to what a test would find than the brochure figure is.
From our database
Everything in this section is computed from our own records, not quoted from anyone. 185 records, queried 1 October 2026.
The average is the least interesting number in it. An 11.4% mean hides machines that lose a quarter of their power on the way to the shaft and machines that lose almost none, so here is the spread across all 185:
- 42 machines lose 15% or more. On a 100 kW tractor that is fifteen kilowatts that never reaches an implement.
- 78 lose between 10% and 15%, which is where most of the corpus sits and is the figure worth carrying in your head.
- 60 lose less than 10%.
- 5 measured higher at the shaft than the maker claimed at the engine. That is not an error in the test. A claimed figure is a round number a marketing department signed off, and five engines turned out to be slightly better than the number on the brochure.
We band each machine on its gap expressed as a percentage and rounded to one decimal place, so a tractor at exactly 10.0% counts in the 10–15% group. Recompute any figure on this page from the two kilowatt numbers on that tractor’s own page and you will land where we did.
Where the tested machines come from, and why it limits what we can say. Of the 185 tractors carrying both figures, 64 were first built in the 1990s and 117 in the 2000s. Those two decades account for almost the whole tested sample. No other decade reaches ten machines, so we will not tell you how the gap has changed over a century — we do not hold the evidence for that sentence, and the honest thing is to say so rather than draw a line through four data points.
It also means the figures above describe tractors of roughly the last thirty years. A 1960s machine with a different driveline may behave differently, and we cannot show you that it does.
3,232 machines have sourced specifications on this site. The 185 in this section are the ones where a laboratory has actually put the shaft on a dynamometer, and that is a small fraction on purpose: we would rather publish a narrow measured claim than a broad estimated one.
What we hold, and what we do not
232 laboratory test reports sit behind published pages on this site — every one of them cited on the tractor it belongs to, with the standard it was measured to named beside the figure. That is a small number against 3,232 machines, and we would rather say so than imply the corpus is more tested than it is. Most tractors ever built were never put on a test bed, and for those the claimed figure is the only figure that exists.
Where we hold a measurement, the tractor’s own page shows it next to the claim, with both labelled. Where we do not, the page says the figure is a manufacturer’s claim and leaves it at that.
Common questions
- Does a tractor lose power between the engine and the PTO?
- Yes. Power passes through the clutch, the PTO drive and its gearing, and each takes a share. Across the 185 tractors where we hold both a claimed engine figure and a laboratory measurement at the shaft, the average loss at the engine's rated speed is 11.4%.
- Is a manufacturer's power figure wrong?
- No. It describes a different place on the machine. The maker states power at the engine flywheel; the test house measures it at the power take-off, after the driveline. Both are true, and the gap between them is mechanical loss rather than exaggeration.
- Which figure should I compare between two tractors?
- The measured one, where it exists, and only against another measured one taken at the same test condition. Comparing a measured figure with a claimed one tells you about the test, not the tractor.
Sources
- OECD standard codes for the official testing of agricultural tractors, test reports cited per figure — OECD. Figures from these test reports are cited per machine on each model page, from the report records in our database; we hold no fetched copy of the OECD programme's web pages.
- Traktorenlexikon, the model articles cited on each tractor's page — Wikibooks, CC BY-SA 4.0. Retrieved . Original