Where claimed and measured tractor power differ most
Three conditions, three answers, and only one of them compares like with like.
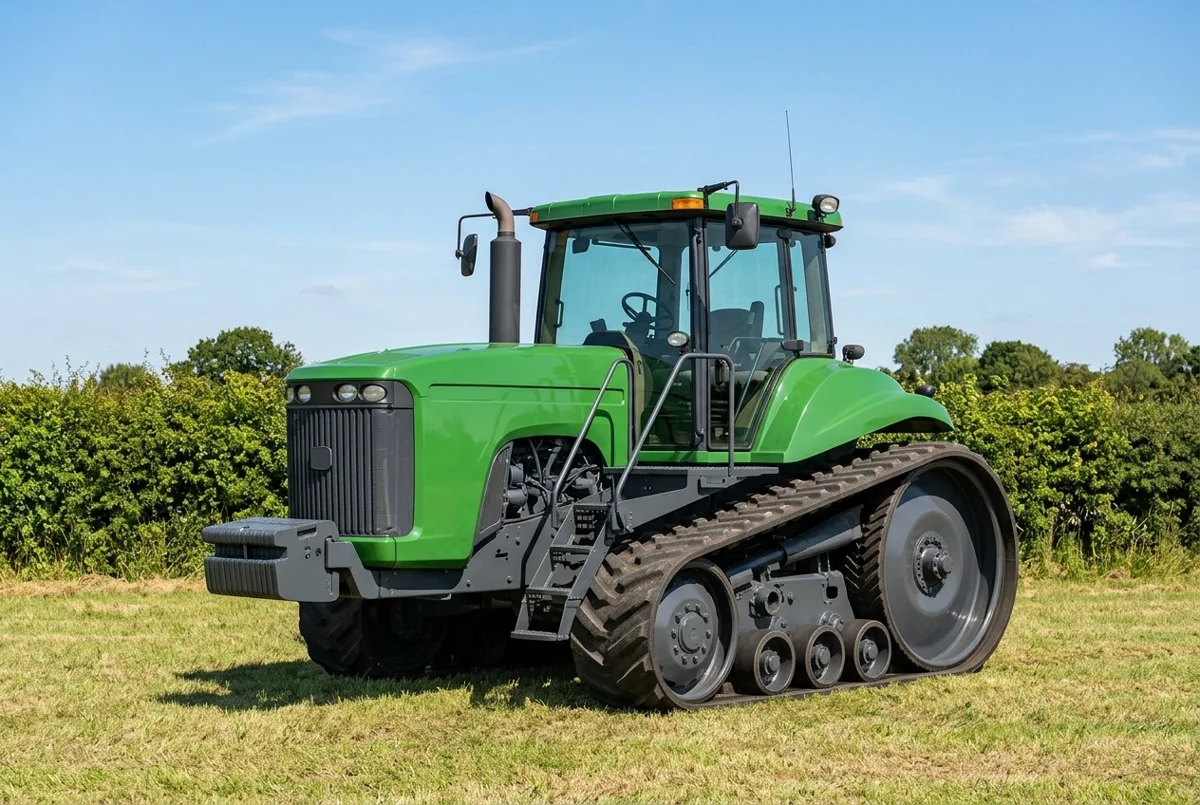
The John Deere 9620T, one of the machines discussed below.
A tractor brochure quotes one power figure. A laboratory measures another. On the 185 machines where we hold both, the second is lower than the first on 180 of them — by 11.4% on average, and by 34.3% on the widest.
That sounds like an accusation. It is not one, and the rest of this page is mostly about why.
From our database
We publish both figures for 185 tractors: the engine power the manufacturer stated, and the power a testing laboratory measured at the power take-off shaft. Both appear on the machine’s own page, each with the document it came from.
Compared at the engine’s rated speed, the shaft gives 11.4% less than the claim on average. It is lower on 180 machines and higher on 5 — which is the first reason to be careful about the word “overstatement”.
The spread matters more than the average. 60 machines lose under 10%, 78 lose between 10% and 15%, and 42 lose more than 15%.
| Machine | Claimed at the engine | Measured at the shaft | Gap | Test |
|---|---|---|---|---|
| John Deere 9620 T (2002) | 493 hp | 324 hp | 34.3% | OECD 2265 |
| John Deere 9400 T | 419 hp | 300 hp | 28.5% | OECD |
| New Holland T4.75 | 84 hp | 63 hp | 25.2% | OECD |
The twentieth-widest gap is 17%, so the top of this table is not a handful of freaks with an ordinary tail behind them. Close to a quarter of the whole set — 42 machines of 185 — gives up more than 15% of its power before the shaft.
Why this is loss and not exaggeration
Power is made at the crankshaft. Work is done somewhere else.
Between the two sit a clutch, a gearbox, a final drive and, on most machines, a hydraulic pump and a cooling fan that run whether or not anything is attached. Every one of them takes a share. What arrives at the splined shaft at the back of the tractor is what is left, and it is the only figure that describes what an implement will actually receive.
So the gap is mechanical. It is not a maker inflating a number; it is the difference between two places on the same machine. The clearest evidence for that is the 5 machines in this set where the measured shaft figure came in above the claimed engine figure. An engine that beats its own rating is ordinary. A manufacturer systematically exaggerating would not produce those.
The comparison is only fair at one engine speed
This is the part that is easy to get wrong, and we have got it wrong on this project before.
A claimed engine figure is a rated figure: it is quoted at the engine’s rated speed. A laboratory does not run the shaft at only one speed — it records power at rated speed, at the standard 540 or 1000 rpm PTO speed, and at whatever speed produces maximum power. Those are three different conditions, and the same set of machines gives three different answers:
- at the engine’s rated speed, the claim’s own condition — 11.4%
- at the standard PTO speed — 8.8%
- at maximum power — 4.8%
All three figures are correct. Only the first compares like with like. Quoting the last one is flattering and wrong, because it sets a rated claim against the engine’s best moment, at a different speed.
That is not a hypothetical caution. The first version of the table on this page was computed at maximum power and reported an average gap of 4.8% — less than half the real figure — before the condition was noticed.
The widest gaps are tracked machines, and we are not going to tell you why
The three widest gaps belong to tracked tractors, and our records say so: each one carries tracks on its variants rather than wheels.
The obvious conclusion is that an undercarriage costs more than a pair of wheels. It may. But the 18 tracked machines in this set average 15.3% against 11% for the 167 wheeled ones, and the tracked machines are also the biggest machines in the set — where the larger tractors generally gap more than the smaller ones regardless of what they run on.
With 18 tracked machines we cannot separate the running gear from the size, and we are not going to assert a cause we have not measured. The observation is in the data. The explanation is not.
The figure nobody stated
Here is the part that should worry a buyer more than any gap.
Of the 185 machines in this comparison, the number whose manufacturer stated which standard its claimed engine figure was measured to is 0.
Not one. Gross or net, to DIN or SAE or ISO or to nothing in particular — the brochure figure arrives unlabelled. A gross figure is taken with the fan, alternator and exhaust removed or unloaded; a net figure is taken with them fitted. The difference between them on the same engine can be several per cent on its own, before the transmission has taken anything.
So part of the 11.4% average is transmission loss, and part of it may simply be that some of these claims were gross figures and some were net, and no one said which. That is why every power figure on this site states what kind of number it is, and says plainly when the source never stated a standard rather than quietly picking one.
What to do with this
Compare measured against measured, at the same condition, and the comparison means something. Compare a measured figure against a brochure figure and you are measuring the test, not the tractor.
The PTO hp list has every machine we hold a laboratory figure for, each row naming the test behind it. The engine power versus PTO power guide works through the mechanism in more detail.
The machines themselves are worth looking at directly. The John Deere 9620 T carries both of its figures with the test report that produced the measured one. The twenty widest gaps are spread across six manufacturers rather than concentrated in one — Case-IH contributes six of them and John Deere five, with the rest split between New Holland, Claas, Renault and Deutz-Fahr. Each brand page lists every model we hold, with measured power wherever a laboratory test exists.
Common questions
- Do manufacturers overstate tractor horsepower?
- No, and the figures do not support saying so. A maker quotes power measured at the engine; what reaches the power take-off shaft has passed through the transmission and the final drive, and those take their share. Across 185 machines where we hold both numbers the shaft is 11.4% lower on average, which is mechanical loss. On 5 machines the shaft measured higher than the claim.
- Why does the same tractor have more than one PTO figure?
- Because a laboratory runs the shaft at more than one condition. The same machines average 11.4% below the claim at the engine's rated speed, 8.8% at the standard 540 or 1000 PTO speed, and 4.8% at maximum power. All three are true. Only the first compares like with like, because a claimed engine figure is quoted at rated speed.
- Which figure should I use when comparing two tractors?
- The measured one, and only against another measured one taken at the same condition. Comparing a measured figure with a claimed one tells you about the test, not about the tractor. Every power figure on this site states whether it was claimed or measured, and names the standard where the source gave one.
Sources
- OECD standard codes for the official testing of agricultural tractors — OECD. Every measured figure counted here comes from a test report record in our database and is cited on the machine's own page by report number; we hold no fetched copy of the OECD programme's web pages.
- Traktorenlexikon, the model articles cited on each tractor's page — Wikibooks, CC BY-SA 4.0. Retrieved . Original